
Contributed by Paul St. Amand, Zhenqi Su, and Guihua Bai
Fhb1 is a quantitative trait locus for FHB resistance with the largest effect on FHB disease severity. Diagnostic markers for Fhb1 were developed by comparing the genomic sequences of TaHRC, the causal gene for Fhb1, between near-isogenic lines contrasting in Fhb1 alleles and FHB phenotypic effects (1,2). The Fhb1-TaHRC-KASP marker was developed based on the functional sequence indel in TaHRC (2) and validated as a diagnostic marker in a worldwide wheat collection (1). The susceptible primer begins at base 13,649,309 on chromosome 3B in the IWGSC wheat reference genome v2.0.
Markers for FHB1
Fhb1-TaHRC-KASP primers:
Fhb1-TaHRC-S-FAM-INS GAAGGTGACCAAGTTCATGCTTTGTCTGTTTCGCTGGGATG
Fhb1-TaHRC-R-HEX-DEL GAAGGTCGGAGTCAACGGATTGCTCACGTCGTGCAAATGGT
Fhb1-TaHRC-Rev CTTCCAGTTTCTGCTGCCAT
PCR conditions:
The Fhb1-TaHRC-KASP marker works with the standard published KASP PCR profile (57°C touchdown) or with a 60°C non-touchdown KASP profile. Additional cycles at the final Tm are usually needed. Standard KASP master mix (https://www.biosearchtech.com/products/pcr-kits-and-reagents/pcr-master-mix/kasp-master-mix) or PACE master mix (https://3crbio.com/page/3cr-pace-genotyping-mastermix/) in a 3 to 5 ul reaction with 10 to 100 ng of wet or dry sample DNA work well. Normalization of sample DNA concentrations is not needed, but improves cluster compactness and separation.
Standard KASP profile
- Step 1. 94C, 15 min
- Step 2. 94C, 20 sec
- Step 3. 65C, 1 min, -0.8C/cycle
- Step 4. Goto step 2, 9 more times
- Step 5. 94C, 20 sec
- Step 6. 57C, 1 min
- Step 7. Goto step 5, 25 more times
- Step 8. 10C, 5 min
KASP60 profile
- Step 1. 94C, 15 min
- Step 2. 94C, 20 sec
- Step 3. 60C, 1 min
- Step 4. Goto step 2, 25 more times
- Step 5. 10C, 5 min
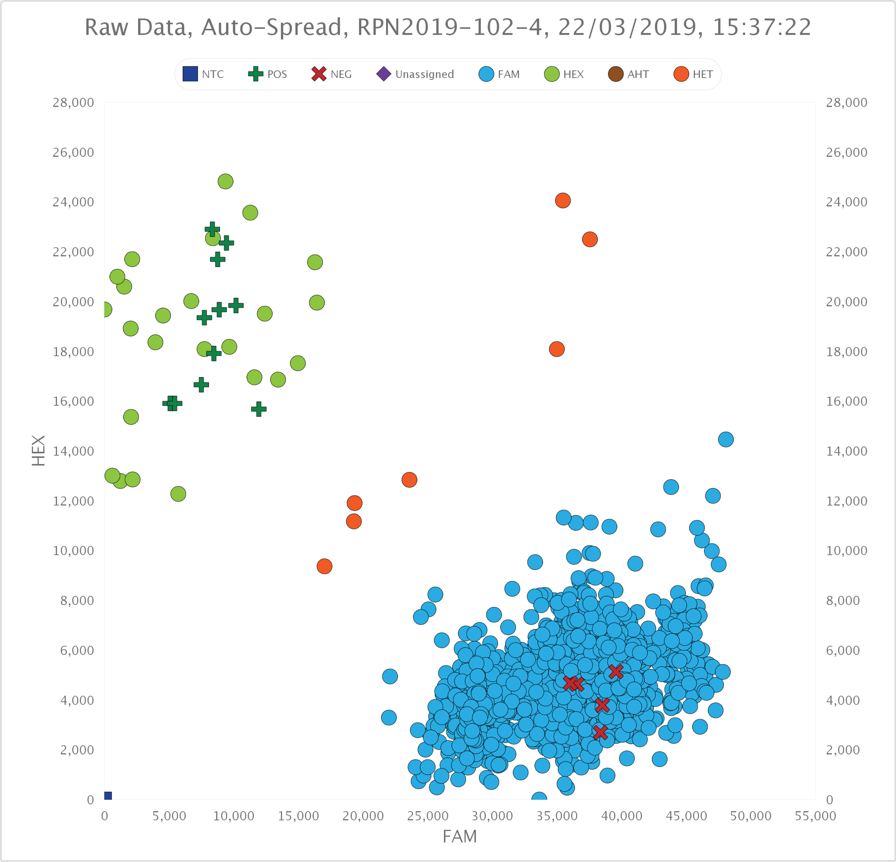
Expected results
Resistant genotypes will cluster along the vertical (HEX) axis. Susceptible genotypes will cluster along the horizontal (FAM) axis. Heterozygotes and heterogeneous samples will cluster between the two homozygous clusters. Additional PCR cycles may be needed to optimize the separation between clusters.
References
1. Development and validation of diagnostic markers for Fhb1 region, a major QTL for Fusarium head blight resistance in wheat. Zhenqi Su, Sujuan Jin, Dadong Zhang, & Guihua Bai. 2018. Theoretical and Applied Genetics, 131:2371–2380, DOI: 10.1007/s00122-018-3159-6.
2. A deletion mutation in TaHRC confers Fhb1 resistance to Fusarium head blight in wheat. Zhenqi Su, Amy Bernardo, Bin Tian, Hui Chen, Shan Wang, Hongxiang Ma, Shibin Cai, Dongtao Liu, Dadong Zhang, Tao Li, Harold Trick, Paul St. Amand, Jianming Yu, Zengyan Zhang, and Guihua Bai. 2019. Nature Genetics 51:1099–1105, DOI: 10.1038/s41588-019-0425-8.